Pytorch 6 :Visualization

导言

  • 执行流程可视化
  • 数据流动可视化
  • 显存占用可视化
  • Loss,网络结构等可视化。

执行流程可视化

python_stack_sniffer

数据流动可视化

torchview

torchlens

可以实现

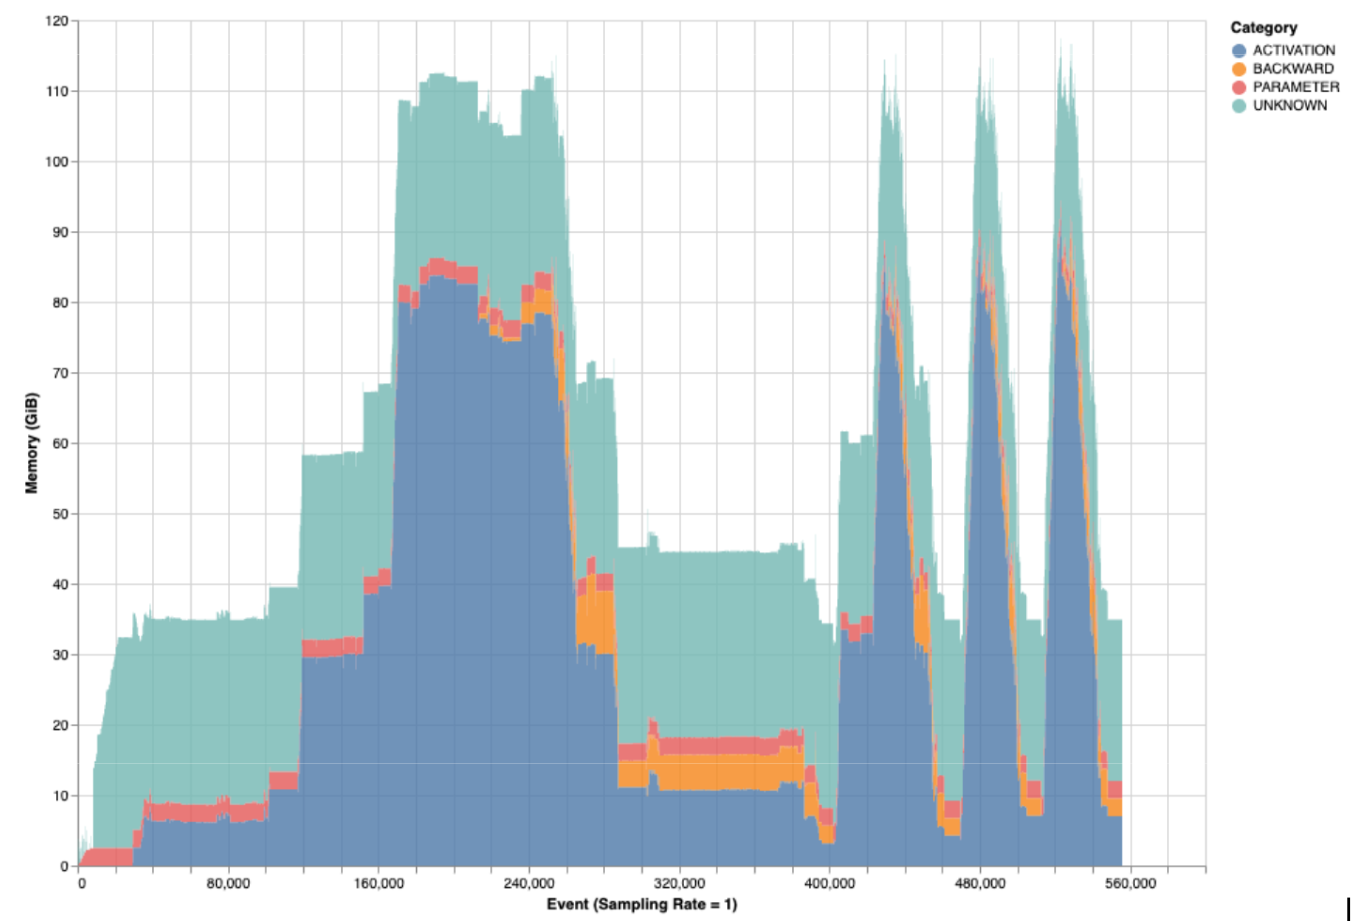
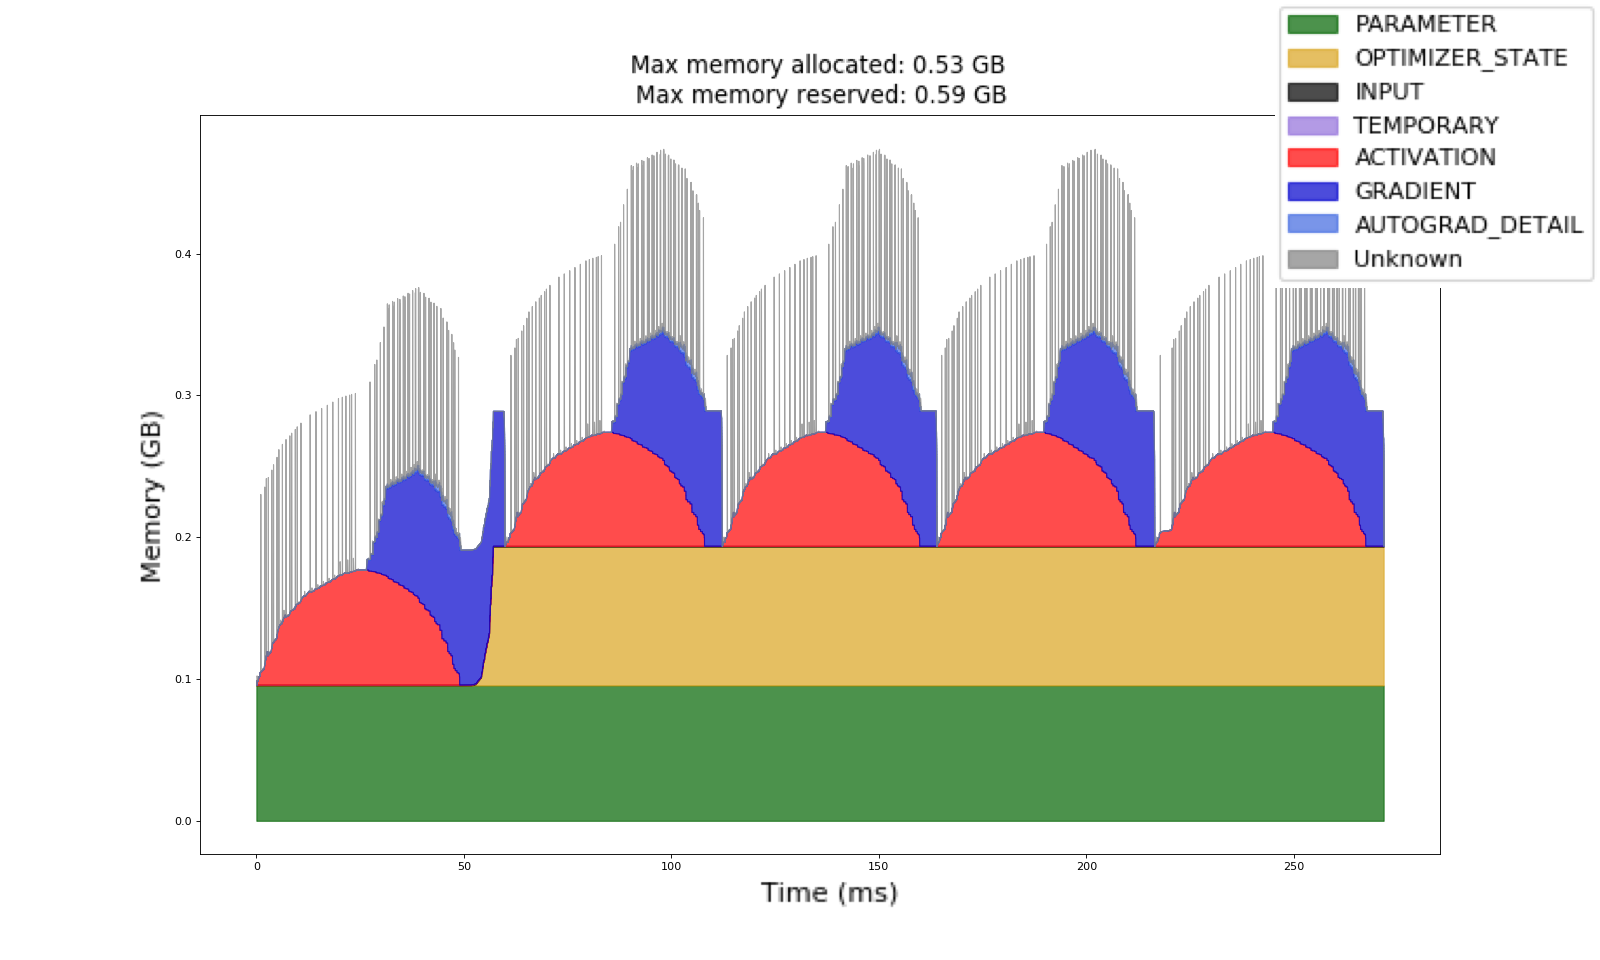
显存占用可视化

显存快照再分析

或者 profile分类

1
2
3
4
5
6
7
8
9
10
11
12
13
14
15
16
17
18
19
20
21
22
23
24
25
26
with torch.profiler.profile(
activities=[
torch.profiler.ProfilerActivity.CPU,
torch.profiler.ProfilerActivity.CUDA,
],
schedule=torch.profiler.schedule(wait=0, warmup=0, active=6, repeat=1),
record_shapes=True,
profile_memory=True,
with_stack=True,
on_trace_ready=trace_handler,
) as prof:
# Run the PyTorch Model inside the profile context.
for _ in range(5):
prof.step()
with record_function("## forward ##"):
pred = model(inputs)

with record_function("## backward ##"):
loss_fn(pred, labels).backward()

with record_function("## optimizer ##"):
optimizer.step()
optimizer.zero_grad(set_to_none=True)

# Construct the memory timeline HTML plot.
prof.export_memory_timeline(f"{file_prefix}.html", device="cuda:0")

实现如下效果

网络结构可视化

自动
https://stackoverflow.com/questions/52468956/how-do-i-visualize-a-net-in-pytorch

或者手动drawio

误差(loss)实时可视化

wandb

xxx

TensorBoard

https://www.cnblogs.com/sddai/p/14516691.html

原理: 通过读取保存的log文件来可视化数据

标量可视化

记录数据,默认在当前目录下一个名为’runs/‘的文件夹中。

1
2
3
4
5
6
from torch.utils.tensorboard import SummaryWriter

# 写log的东西
log_writer = SummaryWriter('./path/to/log')
# 第一个参数是名称,第二个参数是y值,第三个参数是x值。
log_writer.add_scalar('Loss/train', float(loss), epoch)

运行 tensorboard --logdir=runs/ --port 8123 在某端口打开,比如 https://127.0.0.1:6006

网络结构可视化

在tensorboard的基础上使用tensorboardX

1
2
3
4
from tensorboardX import SummaryWriter

with SummaryWriter(comment='LeNet') as w:
w.add_graph(net, (net_input, ))

PR曲线

什么是PR曲线

1
log_writer.add_pr_curve("pr_curve", label_batch, predict, epoch)

x,y轴分别是recall和precision。应该有可能有矛盾的数据,或者网络分不开,对于不同的阈值,可以划分出PR图。

与ROC曲线左上凸不同的是,PR曲线是右上凸效果越好。

实验数据看板

DataEase 变成 一览表的看板

Author

Shaojie Tan

Posted on

2023-06-13

Updated on

2026-07-10

Licensed under